When your team uses AI coding agents, the numbers on your engineering dashboard can become harder to interpret. More pull requests might suggest higher productivity, but that increase alone does not tell you whether your team is delivering more value or creating extra work for reviewers and maintainers.
The issue stems from what these dashboards measure. Most code quality metrics were made for human-authored code. Now, they treat human-written, AI-assisted, and fully agent-generated changes as if they are all the same. As a result, the combined results can look healthy even if one type of contribution drives much more review or maintenance work.
Drawing on 22,000 developers, Faros AI’s 2026 report compares these metrics between each organization’s periods of lowest and highest AI adoption. Incidents per pull request rose by as much as 242.7 percent, the quarterly ratio of deleted to added lines in merged code was 861 percent higher during periods of high AI adoption than during periods of low adoption, and merges without any review rose by 31.3 percent. Altogether, these changes show that the current way of measuring no longer clearly reflects what is happening in production.
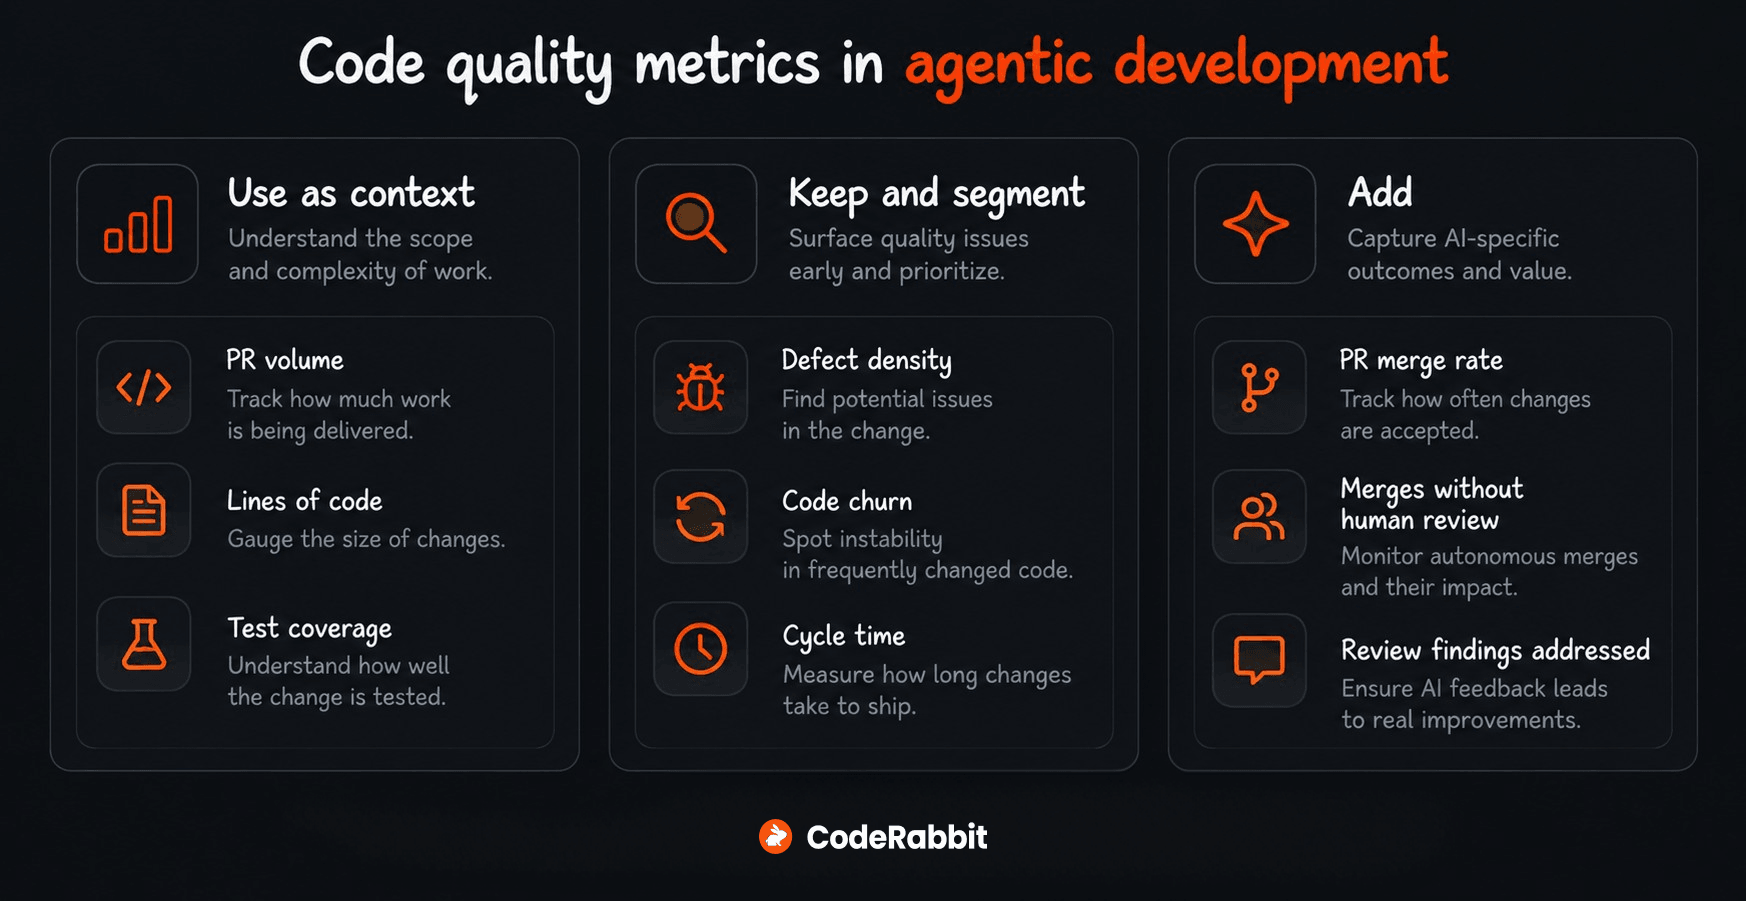
Engineering teams need a better way to measure code quality in this new environment. This means keeping metrics that still reflect software outcomes, rethinking how we interpret input-based metrics, and adding new signals to show whether agent-generated changes were properly reviewed and remained stable after merging.
Metrics that are now misleading on their own
PR volume and lines of code help describe output, but not quality. Test coverage answers a different question: how much of the code ran during testing. Use all three as context, and combine them with what happened during review and after the change was merged.
1. PR volume
PR volume shows how many changes a team proposes.
Why it matters: In the past, a higher PR count usually meant developers were more active. Now, coding agents can open PRs faster than reviewers can keep up, so a higher number might mean the review queue is growing or more changes are being closed without acceptance.
How to measure it: Count PRs opened during a fixed reporting period, separating them by contribution type. Read this alongside the percentage merged within 30 days of being opened.
Benchmark: Compare with the repository’s previous reporting periods. If PR volume rises while the 30-day merge rate falls, investigate whether additional output is translating into accepted work.
2. Lines of code
Lines of code measures how much code is added, changed, or removed. Teams have traditionally used it as a rough measure of developer output.
Why it matters: An AI agent can create hundreds of lines in seconds. A large diff might include valuable work, but its size says little about quality or maintainability. The More Code, Less Reuse study found that agent-created PRs missed more opportunities to reuse existing code and contained more redundancy than human-written contributions.
How to measure it: Track additions and deletions separately for each PR. Before treating a large change as progress, check whether it fits the current design and uses existing components without adding unnecessary code complexity.
Benchmark: Compare changes of similar scope in the same repository. Use unusually large diffs as a prompt for closer review rather than setting a target number of lines developers should produce.
3. Test coverage
Test coverage, or code coverage, shows how much of your code runs during testing.
Why it matters: Coverage is useful only when paired with tests that check the right business behavior. Both the code and tests can follow the same mistaken assumption, producing high coverage even when the requirement was misunderstood.
How to measure it: Use coverage reports to identify untested paths. Then read the assertions and check whether they cover important failure cases. Reviewers should confirm that the expected behavior matches the product requirement.
Benchmark: Use the repository’s coverage baseline to spot regressions, with expectations informed by the risk of the changed code. Meeting a percentage target does not establish that business behavior has been tested correctly.
Metrics that still matter
Defect density, code churn, and cycle time remain useful because they show what happens after changes are accepted. Compare them by contribution type, since a combined figure can hide significant differences between human-authored, AI-assisted, and fully agent-generated code.
1. Defect density
Defect density measures confirmed defects relative to the amount of code changed, often per thousand lines.
Why it matters: More code changes can mean more defects, even if the defect rate doesn't increase. Defect density accounts for change size, so teams can compare different types of contributions instead of focusing only on defect counts.
How to measure it: Divide confirmed defects linked to a set of changes by the number of changed lines, then multiply by 1,000. If there are no changed lines, report defect density as not applicable and report the confirmed defect count separately. Treat a PR as AI-assisted if a developer edits agent-generated code, even when the edit is small. Count defects confirmed within the same fixed period after each PR merges, such as 90 days, and include only PRs whose full observation period has elapsed. Apply the same period to every contribution type, without assuming whether the agent or developer introduced the defect.
Benchmark: Compare with the repository’s historical defect density and changes of similar risk. Keep severity visible so a lower overall rate does not conceal an increase in serious defects.
2. Code churn
Code churn measures how much recently added or modified code is rewritten or removed within a fixed period, commonly 14 or 30 days.
Why it matters: It identifies accepted changes that require substantial follow-up work. High churn can reflect changing requirements or deliberate refactoring. When concentrated in agent-generated changes, it can also point to missing context or misunderstood requirements. In our analysis of agent misalignment, we explain how these gaps lead to repeated prompts and rewrites during review.
How to measure it: Track the share of recently added or modified lines that are rewritten or removed within the chosen window. Compare generated changes with human-authored changes over the same period. Give each line the full chosen observation window, and exclude lines whose window has not elapsed before comparing contribution types.
Benchmark: Use the repository’s historical churn rate and compare similar types of work. Investigate sustained increases, accounting for planned refactoring and requirement changes.
3. Cycle time
Cycle time measures how long a change takes from the first commit to deployment.
Why it matters: In many agentic workflows, the coding phase is no longer a separate step. Agents now write, test, and revise code in a continuous loop, with developers guiding the process. As a result, a shorter implementation period can make ongoing review and correction less visible.
How to measure it: Record the intervals from first commit to PR opening, PR opening to reviewer pickup, and reviewer pickup to approval. Measure approval to deployment separately. For changes merged without reviewer pickup or approval, mark phases that require those events as not applicable. Keep their first-commit-to-deployment interval in the overall cycle time.
Benchmark: Compare the median and slower changes against the repository’s baseline. Examine each phase to see whether faster implementation is accompanied by longer review or deployment delays.
Metrics agentic teams should add
PR merge rate shows how much proposed work is accepted. Tracking human review and action on findings helps teams assess how that work is checked before it enters the codebase.
1. PR merge rate
PR merge rate shows the percentage of opened PRs that are merged within a fixed period, such as 30 days.
Why it matters: It connects PR volume to accepted work. If agent-generated PR volume rises while the merge rate falls, the team may be creating more review work without getting more changes accepted.
How to measure it: Group PRs by when they were opened and calculate the percentage merged within 30 days of creation. Report each contribution type separately, allowing every PR the full observation period.
Benchmark: Compare equivalent groups of PRs within the same repository. Investigate sustained declines and the reasons for rejection or delay; merging more PRs matters only when they meet the team’s quality standards.
2. Merges with zero human review
This metric measures the percentage of PRs merged without a recorded human review or approval.
Why it matters: It shows how much code enters the codebase without direct human oversight. As agents propose more and larger changes, an increase may indicate that review demand exceeds capacity. Some teams also deliberately permit low-risk automated changes without human approval.
How to measure it: Divide merged PRs without recorded human review by all merged PRs in the reporting period, then multiply by 100. Break the results down by repository and change risk.
Benchmark: Use the team’s review policy. For changes requiring human approval, the target is zero unreviewed merges. Track approved automation separately so it does not obscure review gaps.
3. Review findings per change and share addressed
Review findings per change measures how many substantive issues teams identify before merging a change. The share addressed shows how many actionable findings lead to a corresponding code change.
Why it matters: Together, these values show how much feedback changes generate and whether teams act on it. A study of over 22,000 review comments from 178 repositories found that concise, specific comments linked to the relevant code were more likely to result in changes.
How to measure it: Count substantive findings per PR, separating them by contribution type and severity. Calculate the share addressed by dividing findings followed by a corresponding fix by all actionable findings. Exclude status messages and duplicates.
Benchmark: Compare with the repository’s baseline under consistent review rules. Rising findings can reflect poorer submissions or more thorough review. A falling share addressed warrants checking whether feedback was missed, disputed, or irrelevant. Neither value alone establishes review quality.
How CodeRabbit surfaces review-quality signals
CodeRabbit reviews proposed changes before they are merged. The PR Walkthrough feature groups related files, estimates review effort, and checks the implementation against any linked issues. Teams can also set up Pre-Merge Checks as an automated quality gate.
The dashboard lets teams track review findings for each change and see how often developers address them. It displays the average number of review comments per pull request, with CodeRabbit findings sorted by severity and category. The comment acceptance rate shows feedback that CodeRabbit has verified as fully addressed or that a developer has confirmed as fixed.
The time metrics show how long it takes for a pull request to go from ready for review to its first human review, final commit, and merge. Along with reviewer participation and the average number of review rounds, these measurements help teams find where review work is piling up. These metrics focus on the review process.
The dashboard also shows Pre-Merge Check results, including passes, failures, and inconclusive outcomes for both built-in and custom checks. Teams can filter the dashboard by repository, user, team, and timeframe, and export per-pull-request data for deeper analysis. The PR metrics include changes CodeRabbit reviewed and merged during the chosen period.
To compare human-authored, AI-assisted, and fully agent-generated changes, combine these records with contribution labels your team collects. Repository history provides data on code churn, while defect density requires confirmed defect records. This connects the issues found during review with the maintenance work required after changes were merged.
Wrapping up
As agents write more code, teams should measure productivity and software quality based on what happens during code reviews and after deployment. Focus on results like defect density and code churn. Use output and coverage numbers as extra context, and check whether teams addressed actionable review findings before merging changes.
Compare different contribution types using the same reporting periods and repository baselines. Use CodeRabbit to track review activity and how teams handle feedback. Then, combine this information with repository and defect data to see if faster code generation leads to more reliable software.