
Sahana Vijaya Prasad
December 18, 2025
9 min read
December 18, 2025
9 min read
Share
Cut code review time & bugs by 50%
Most installed AI app on GitHub and GitLab
Free 14-day trial
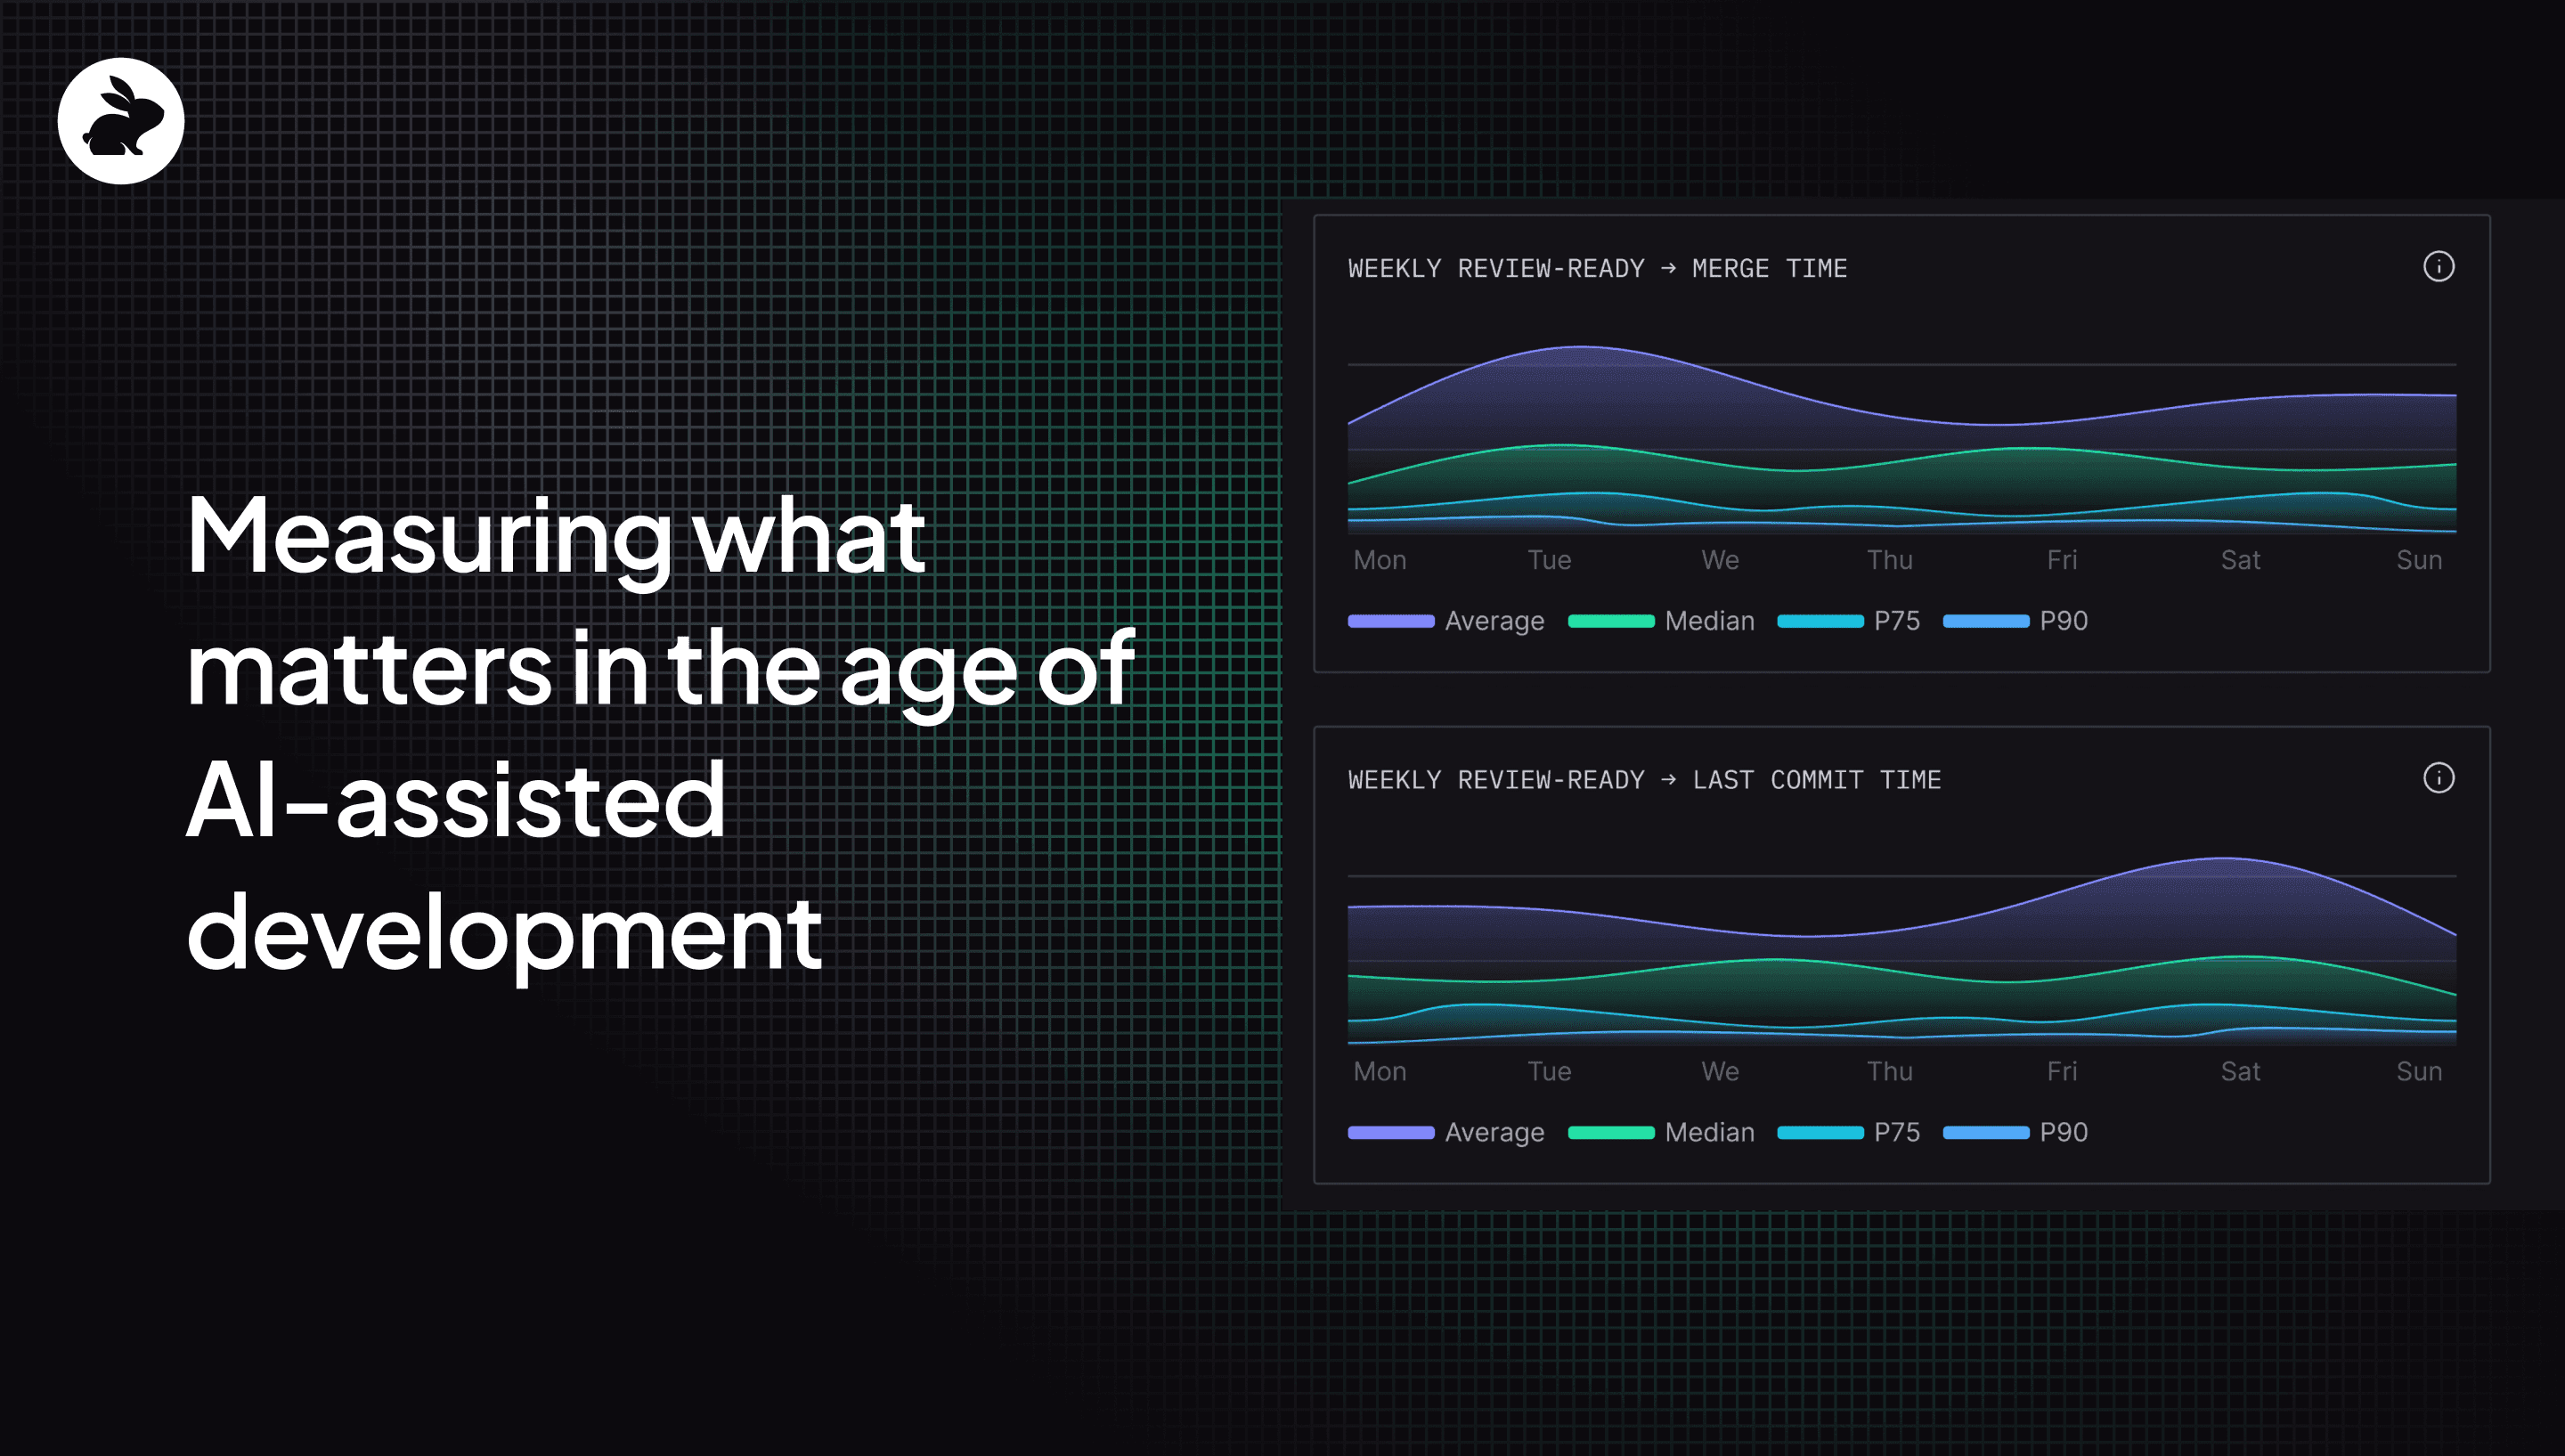
Every engineering leader I talk to is asking the same question: "Is AI actually making us better?"
Not "are we using AI" (everyone is). Not "is AI generating code" (it clearly is). And not even, “What percentage of our code is AI generating?” (unless you’re Google or Microsoft and announce this publicly). The real question is whether AI adoption is translating into shipping faster, better quality code and making for more productive and happier engineering teams.
The problem is that most tooling gives you vanity metrics. Lines of code generated. Number of AI completions accepted. These tell you nothing about what happens after the AI writes code. Does it survive review? Does it ship? Does it break production?
CodeRabbit sits at a unique vantage point in the development lifecycle. We review both human-written and AI-generated code. We see what gets flagged, what gets accepted, and what makes it to merge. We watch how teams iterate, how reviewers respond, and where friction accumulates. We’ve been able to see all those things and knew there was value to that for teams, as well.
So, today, we are releasing a new analytics dashboard that puts this visibility directly into the hands of engineering leaders.
When teams adopt AI tooling, three questions dominate every conversation with directors, VPs, and platform leads:
1. Is our review process faster or slower?
AI-generated code often produces more PRs, larger diffs, and different kinds of issues. If your review process cannot keep up, you have not gained velocity. You have created a bottleneck.
2. Is code quality improving or degrading?
More code is not better code. The question is whether AI-assisted development is catching bugs earlier, reducing security issues, and maintaining the standards your team has set.
3. How do we prove ROI to the business?
Engineering leaders need to justify tooling spend. Saying "developers like it" is not sufficient. You need numbers that connect to business outcomes: time saved, defects prevented, throughput gained.
The CodeRabbit Dashboard answers all three.
The dashboard is organized into five views, each designed to answer a different class of question. Let me walk through what engineering leaders care about most in each section.
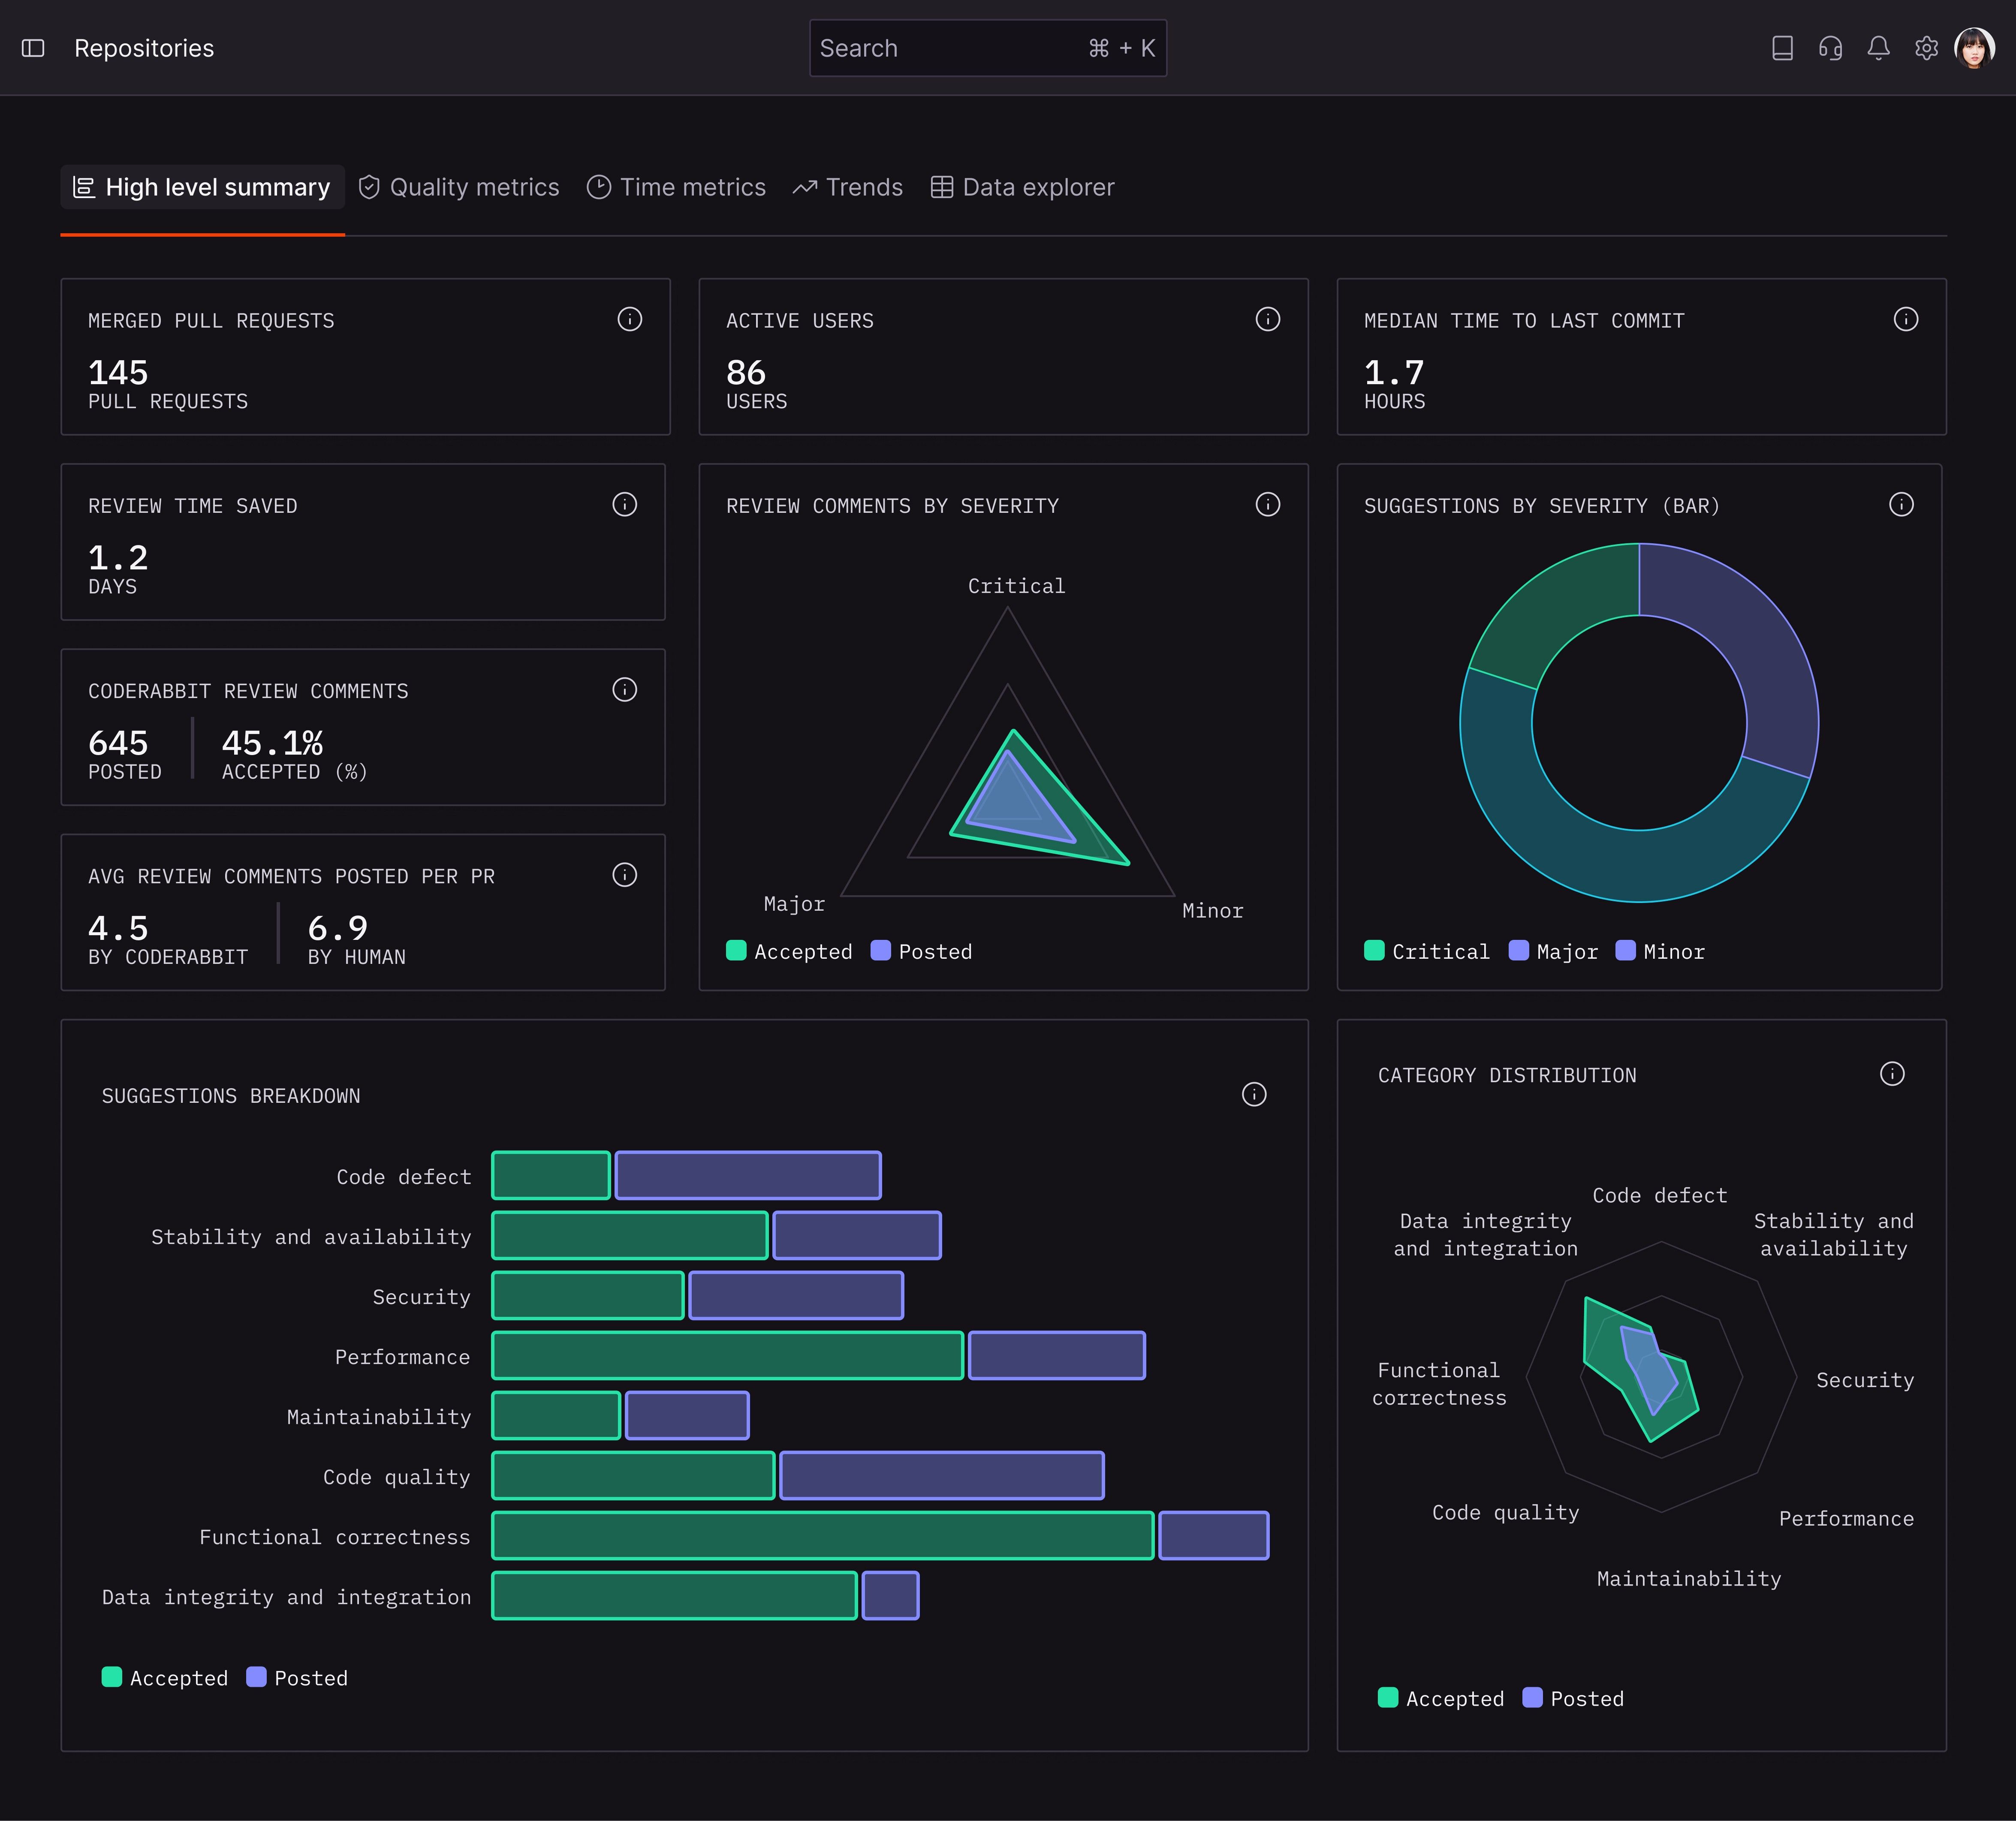
The Summary tab gives you the numbers that matter for a leadership update. In the screenshot above, you can see the core metrics at a glance:
In the screenshot there were 145 merged PRs from 86 active users over the selected period. This is your throughput baseline.
Median Time to Last Commit: This measures how long it takes developers to finalize their changes after a PR becomes ready for review. Short times indicate tight feedback loops and clear reviewer expectations. Spikes here often signal bottlenecks.
Reviewer Time Saved: This metric answers the ROI question. CodeRabbit models the effort of a senior reviewer and estimates how much human review time the AI has offset. For budget conversations, this number translates directly into saved engineering hours.
CodeRabbit Review Comments: A low acceptance rate would indicate noise. A high rate indicates trusted, actionable feedback. Acceptance rate is the quality signal. If reviewers and authors are acting on CodeRabbit feedback at least half the time, the tool is surfacing relevant issues.
The donut charts break down comments by severity (Critical, Major, Minor) and category (Functional Correctness, Maintainability, Security, Data Integrity, Stability). This tells you what kinds of problems CodeRabbit is catching. If most comments are Minor/Maintainability, that is a different story than Critical/Security.
Average Review Iterations per PR: Always know how many cycles a typical PR goes through before merge. High iteration counts can indicate unclear requirements, poor PR quality, or overloaded reviewers. Tracking this over time shows whether your process is tightening or loosening.
Tool Findings: CodeRabbit surfaces findings from your existing static analysis tools. This consolidates your quality signals into one view.
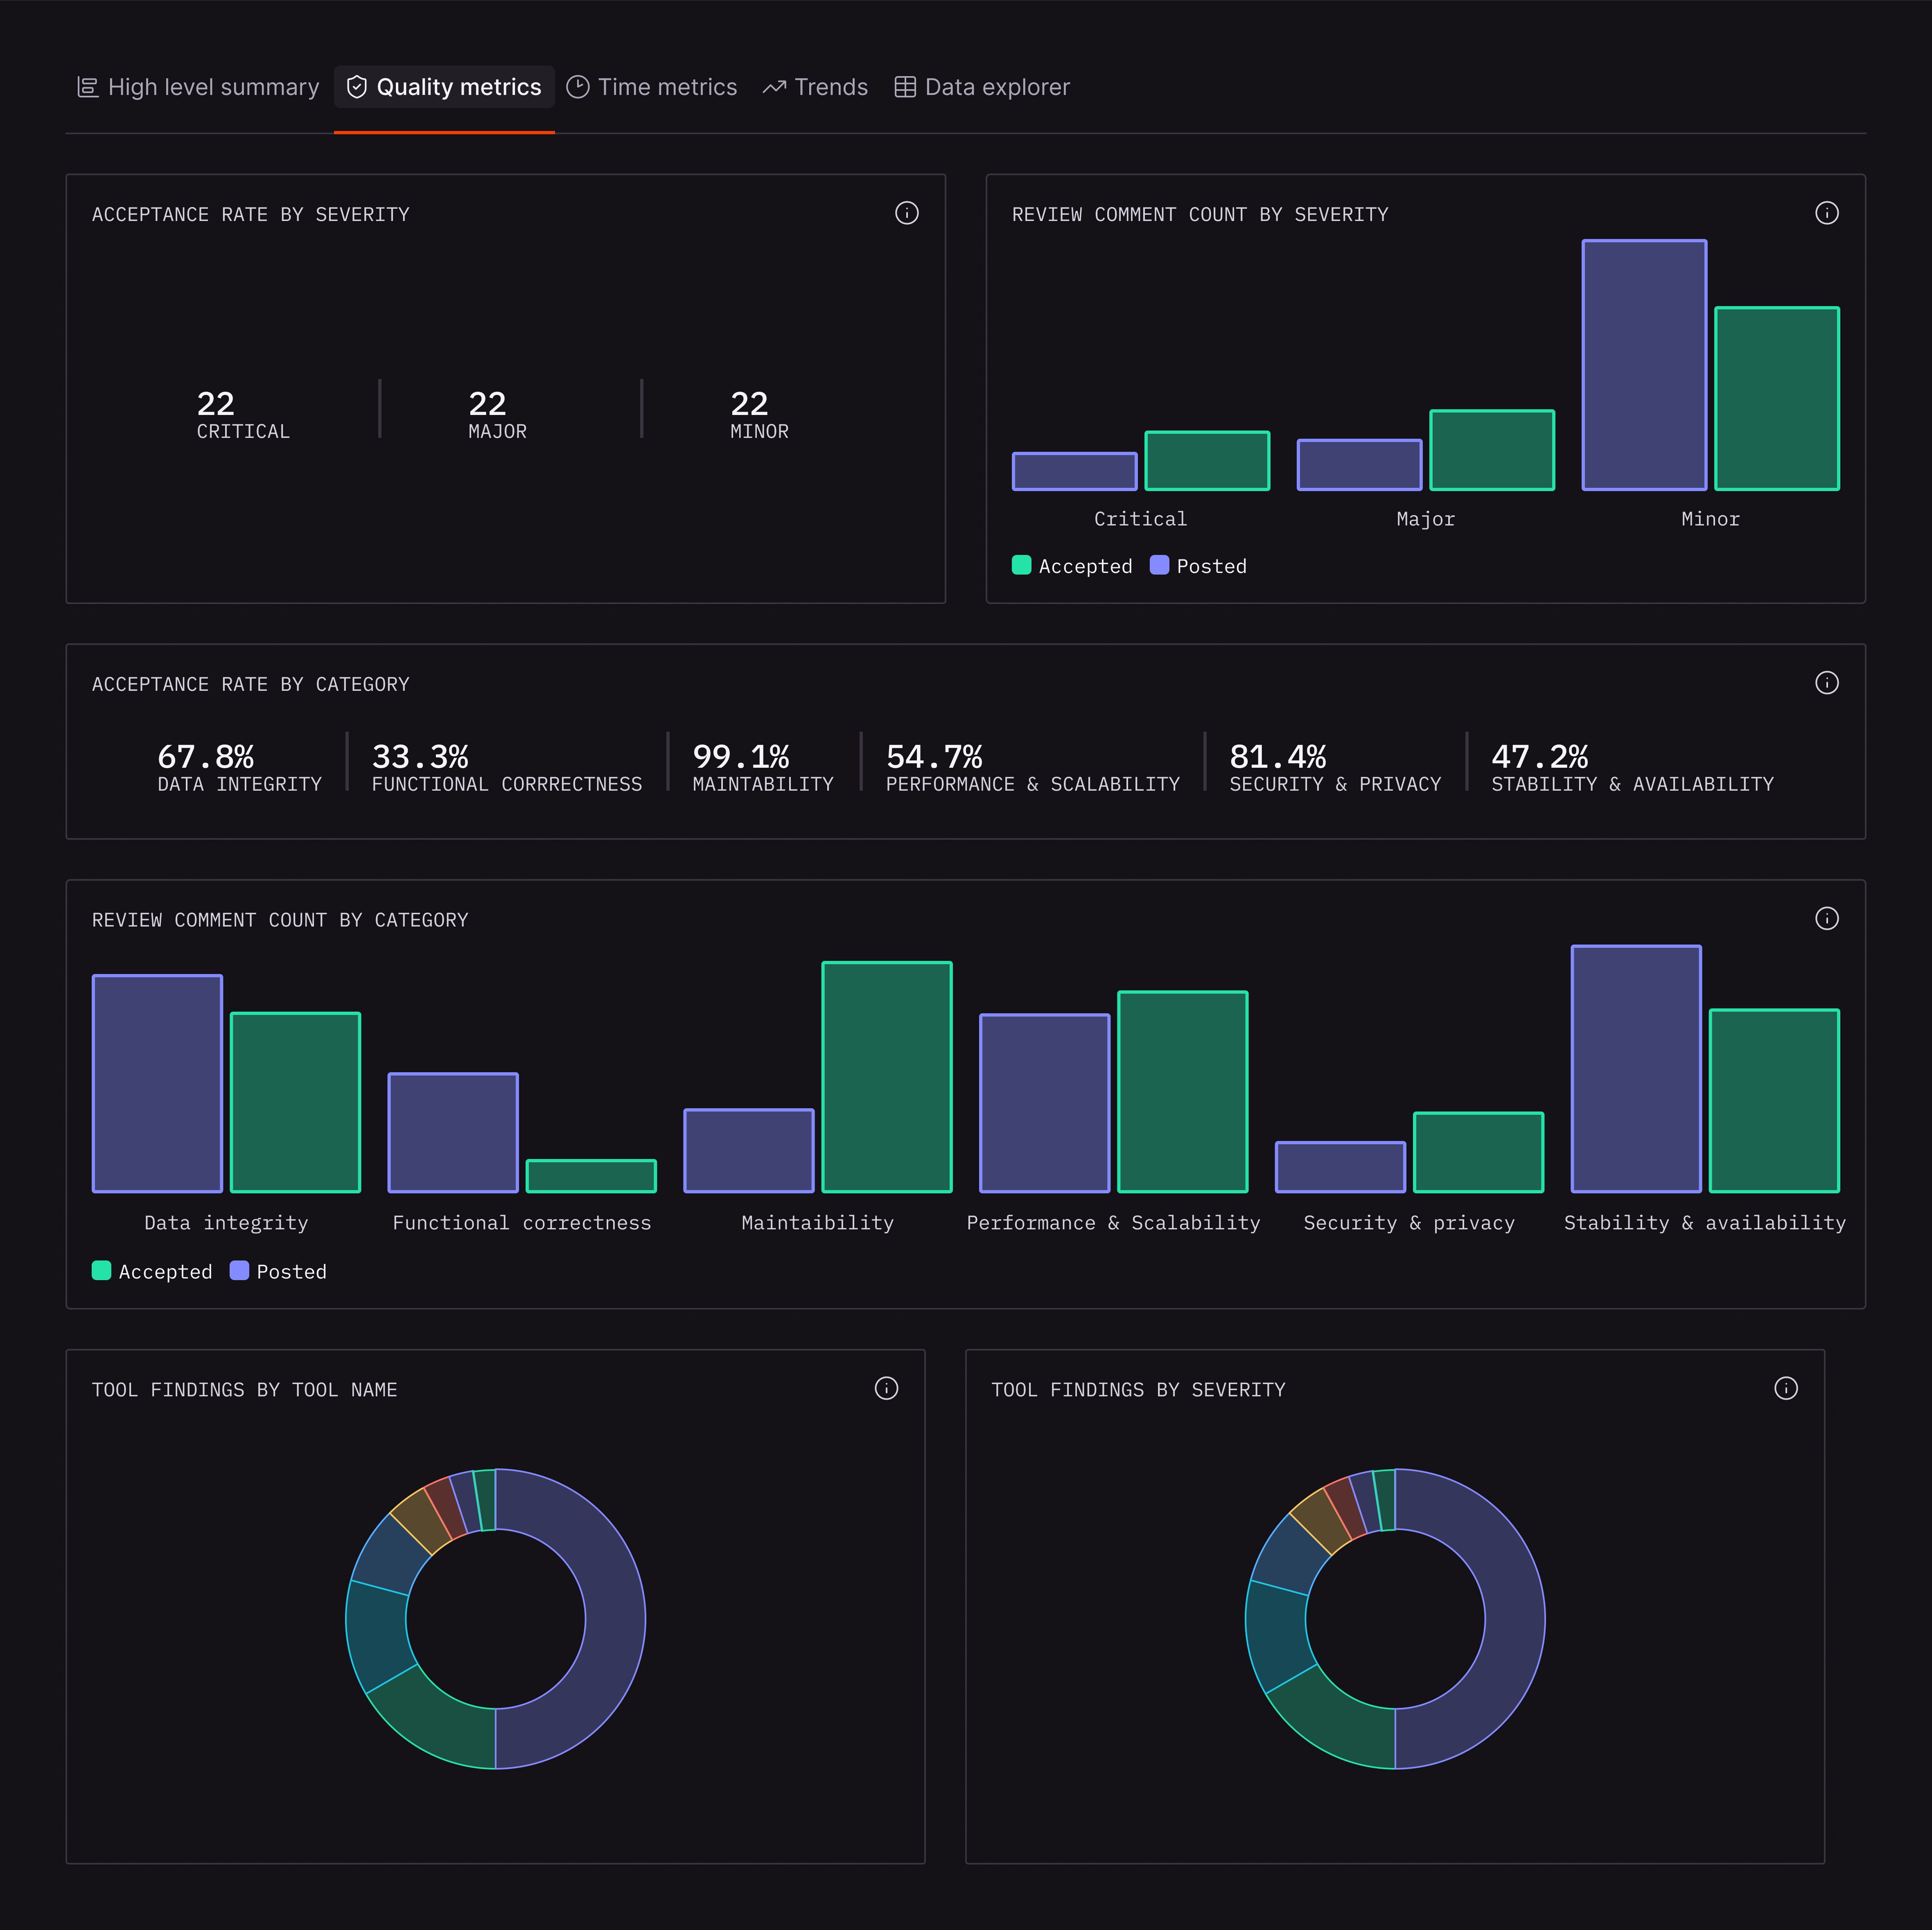
The Quality Metrics tab answers: "Is CodeRabbit catching the right things?"
Acceptance Rate by Severity: How often developers act on CodeRabbit comments at each severity level? Consistent acceptance across severity levels suggests CodeRabbit is calibrated well to your team's standards.
Acceptance Rate by Category: This breaks it down further:
Data Integrity and Integration
Functional Correctness
Maintainability and Code Quality
Security and Privacy
Stability and Availability
These numbers help you understand where CodeRabbit adds the most value. If Security acceptance is low, it might indicate false positives in that category. If Maintainability acceptance is high, developers trust CodeRabbit for code quality guidance.
Bar charts: These show raw counts. How many comments were posted versus accepted in each category. This gives you more info about what kinds of comments you’re finding.
Tool Findings: This breakdown shows which static analysis tools contributed findings so you’re aware which are providing more findings for your codebase.
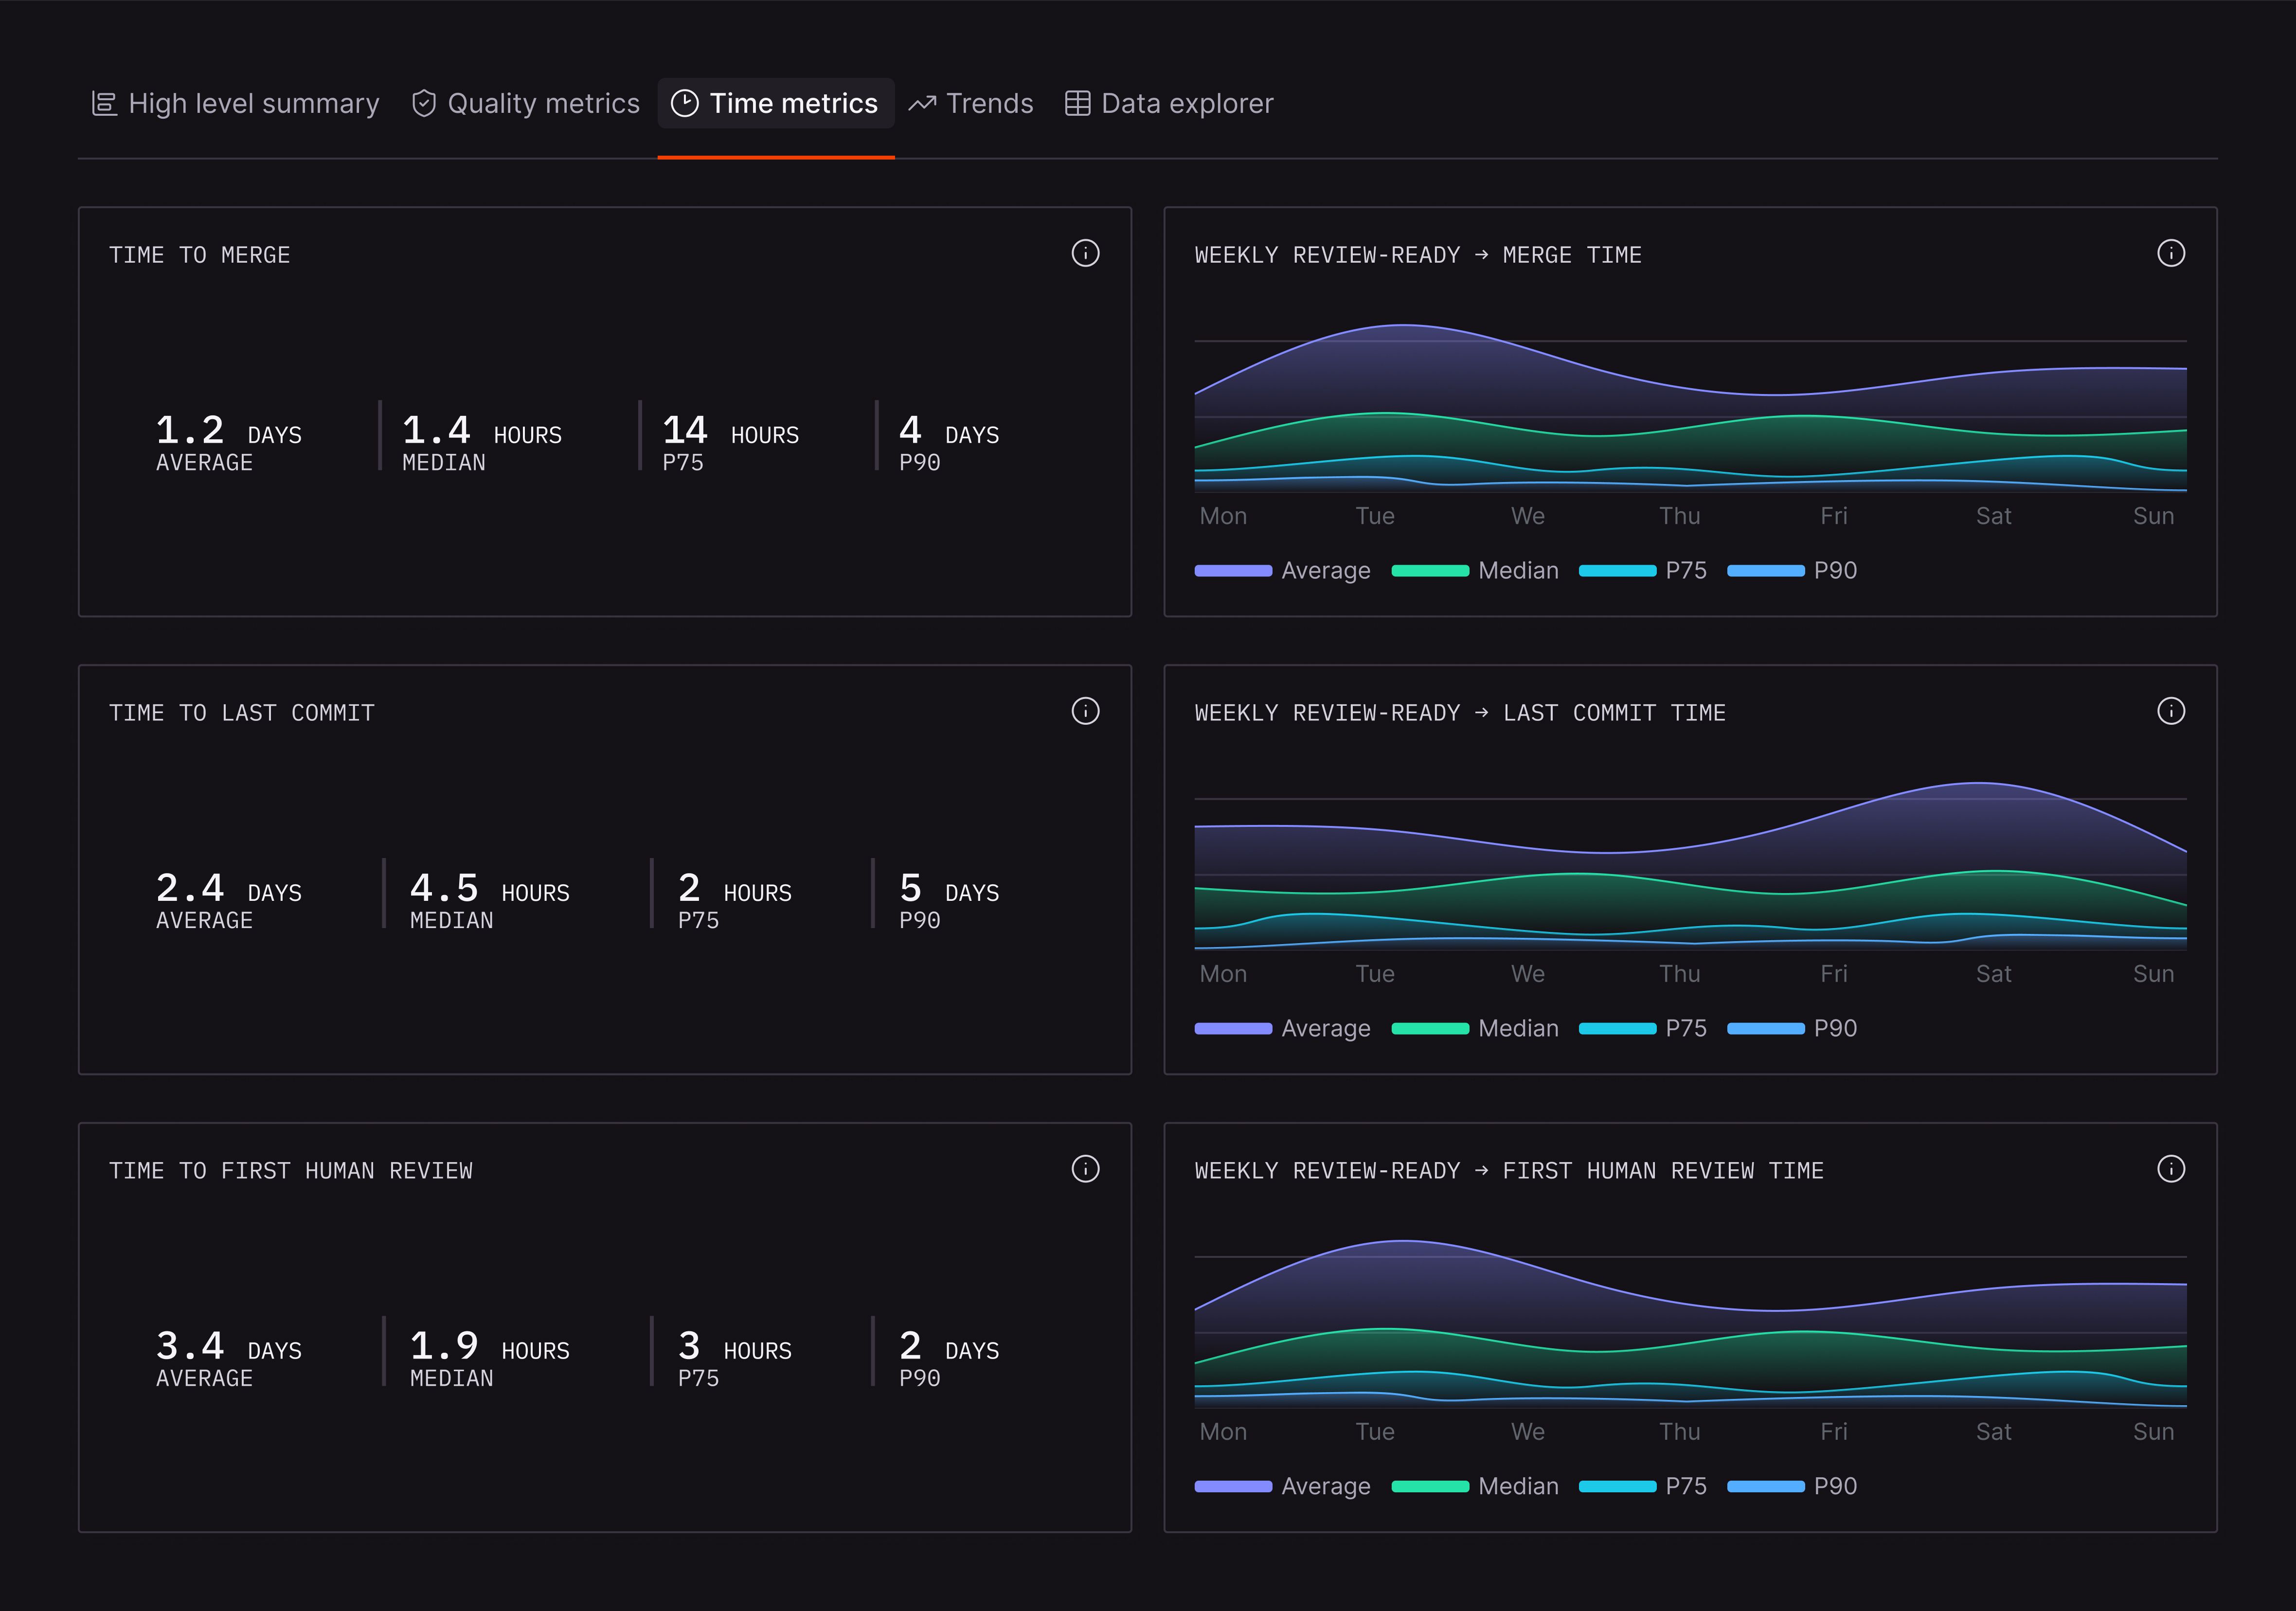
The Time Metrics tab tracks velocity through the review process. This is the data you need to find bottlenecks so you can fix them.
Time to Merge: We measure the full duration from review-ready to merged, these include looking at various metrics including these figures as shown in the above example:
Average: 1.2 days
Median: 1.4 hours
P75: 14 hours
P90: 4 days
The gap between median and P90 is revealing in the example. Most PRs merge in 1.4 hours, but the slowest 10% take nearly 4 days. That tail is worth investigating.
Time to Last Commit: This focuses on how long it takes developers to complete their final changes. Here’s the data in the above example:
Average: 2.4 days
Median: 4.5 hours
P75: 2 hours
P90: 5 days
Compare this to Time to Merge. If the last commit happens quickly but merge takes much longer, PRs are sitting idle after code is done. That delay often comes from approval bottlenecks, release gates, or unclear ownership.
Time to First Human Review: How long do PRs wait before a human looks at them? Here’s the example in the screenshot:
Average: 3.4 days
Median: 1.9 hours
P75: 3 hours
P90: 2 days
The median here is under 2 hours, but the average is dragged up by outliers. The weekly trend charts on the right side of the dashboard let you track whether these metrics are improving or regressing.
The Organizational Trends tab shows patterns over time.
Weekly Pull Requests: Created and Merged PRs plots your team's throughput. In the screenshot, both created and merged PRs trend downward from mid-November toward December. This could reflect end-of-year slowdown, a shift in project priorities, or an emerging backlog.
Weekly Active Users: Is where you look for engagement. The chart shows fluctuation between weekly active users, with a dip around late October.
Weekly Pipeline Failures: Here you can track CI/CD health. Here the decrease in CodeRabbit users correlates with additional pipeline failures.
Most Active PR Authors and Reviewers: Here’s where you can identify contribution patterns. In this data, multiple authors are tied for first place on both creating and reviewing PRs. This could indicate that these engineers are all at risk of being overwhelmed which could lead to a backlog.
The Data Metrics tab provides per-user and per-PR detail for teams that need auditability, coaching insights, or root cause analysis.
Active User Details table: This shows each developer's activity including PRs created and merged, time to last commit, total comments posted, and acceptance rates broken down by severity. You can see at a glance who is shipping frequently, who has long review cycles, and whose code generates more critical feedback.
Pull Request Details table: This looks at individual PRs with info about their repository, author, creation time, first human review time, merge time, estimated complexity, reviewer count, and comment breakdown. For any PR that took unusually long or generated unusual feedback patterns, you can dig into the specifics.
Tool Finding Details table: Here you’ll find a list of every static analysis finding by tool, category, severity, and count. This is useful for identifying which rules generate the most noise and which surface the most value.
We are in a transition period for software development. AI is generating more code than ever. Developers are reviewing code they did not write. Engineering managers are being asked to prove that AI investments are paying off.
The organizations that navigate this transition well will be the ones with visibility into their own processes. Not just "are we using AI," but "is AI helping us ship better software faster."
CodeRabbit is one of the few tools positioned to answer that question. We see the code. We see the reviews. We see what ships. And now, with these dashboards, engineering leaders can see it too.
The dashboards are available now for all CodeRabbit users. Filter by repository, user, team, or timeframe to analyze performance in the context that matters most to your organization.
If you are an engineering leader trying to measure AI impact, this is where you start.
Curious? Try CodeRabbit today with a 14-day free trial.


